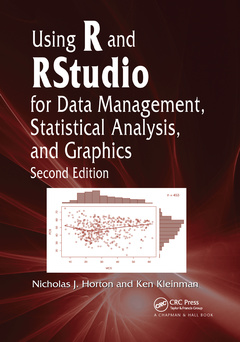
Using R and RStudio for Data Management, Statistical Analysis, and Graphics (2nd Ed.)
Auteurs : Horton Nicholas J., Kleinman Ken

Improve Your Analytical Skills
Incorporating the latest R packages as well as new case studies and applications, Using R and RStudio for Data Management, Statistical Analysis, and Graphics, Second Edition covers the aspects of R most often used by statistical analysts. New users of R will find the book?s simple approach easy to understand while more sophisticated users will appreciate the invaluable source of task-oriented information.
New to the Second Edition
- The use of RStudio, which increases the productivity of R users and helps users avoid error-prone cut-and-paste workflows
- New chapter of case studies illustrating examples of useful data management tasks, reading complex files, making and annotating maps, "scraping" data from the web, mining text files, and generating dynamic graphics
- New chapter on special topics that describes key features, such as processing by group, and explores important areas of statistics, including Bayesian methods, propensity scores, and bootstrapping
- New chapter on simulation that includes examples of data generated from complex models and distributions
- A detailed discussion of the philosophy and use of the knitr and markdown packages for R
- New packages that extend the functionality of R and facilitate sophisticated analyses
- Reorganized and enhanced chapters on data input and output, data management, statistical and mathematical functions, programming, high-level graphics plots, and the customization of plots
Easily Find Your Desired Task
Conveniently organized by short, clear descriptive entries, this edition continues to show users how to easily perform an analytical task in R. Users can quickly find and implement the material they need through the extensive indexing, cross-referencing, and worked examples in the text. Datasets and code are available for download on a supplementary website.
Data Input and Output. Data Management. Statistical and Mathematical Functions. Programming and Operating System Interface. Common Statistical Procedures. Linear Regression and ANOVA. Regression Generalizations and Modeling. A Graphical Compendium. Graphical Options and Configuration. Simulation. Special Topics. Case Studies. Appendices.
Nicholas J. Horton is a professor of statistics at Amherst College. His research interests include longitudinal regression models and missing data methods, with applications in psychiatric epidemiology and substance abuse research.
Ken Kleinman is an associate professor in the Department of Population Medicine at Harvard Medical School. His research deals with clustered data analysis, surveillance, and epidemiological applications in projects ranging from vaccine and bioterrorism surveillance to observational epidemiology to individual-, practice-, and community-randomized interventions.
Date de parution : 12-2020
17.8x25.4 cm
Date de parution : 04-2015
17.8x25.4 cm
Thèmes d’Using R and RStudio for Data Management, Statistical... :
Mots-clés :
Min 1Q Median 3Q Max; Dplyr Package; R; Mosaic Package; data management; GLMM; statistical analysis; Regression Model; descriptive summaries; NA NA NA; inferential procedures; Item Response Theory Model; regression analysis; Cumulative Distribution Function; multivariate methods; Roc Curve; creation of graphics; Propensity Score; data visualization; PCS Score; simulations; Native Dataset; statistical models; Graphics Device; statistical tests; Tick Marks; RStudio; Di Ze; reproducible analysis system; Choropleth Map; knitr; Code Chunk; NA NA NA NA NA; String Variables; Residual Deviance; Cochran Mantel Haenszel Test; BMP; Epi Info; Imputation Models; Regression Coefficient Plot


