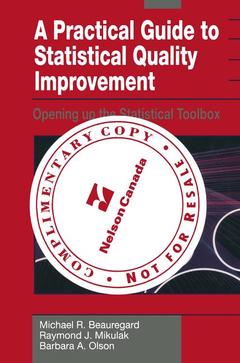
A Practical Guide to Statistical Quality Improvement, Softcover reprint of the original 1st ed. 1992 Opening up the Statistical Toolbox
Langue : Anglais
Auteurs : Beauregard Michael R., Mikulak Raymond J., Olson Barbara A.

A Practical Guide to Statistical Quality Improvement: Opening Up the Statistical Toolbox is designed as a reference guide for the engineer, supervisor, and manager. The intent of the text is to present conventional statistical quality improvement tools in a user-friendly form. We have worked to take some of the "mystique" out of the statistics and help others put these powerful tools to effective use in a Total Quality Manage Management (TQM) environment. This isn't a text on TQM. TQM has three elements (as shown in Figure i.1): 1. Creating the environment 2. The continuous improvement toolbox 3. Employee empowerment This text focuses almost exclusively on the middle element, the continuous improvement (CI) toolbox. Further, Opening Up the Statistical Toolbox does not present a complete set of tools intended to "fill" the CI toolbox; only the statistical tools and some of the basic team process tools are covered. The CI toolbox, in reality, will never get "filled". A comprehensive toolbox will include extensive team process skills and technology specific tools complimentary to the statistical tools included here. THE THREE KEY ELEMENTS OF TQM THE CONTINUOUS IMPROVEMENT TOOLBOX EMPLOYEE EMPOWERMENT FIGURE i.I.
1 Fundamental Concepts of Total Quality Management.- 1.1 TQM—How Does It Work?.- 1.2 TQM Leaders.- 1.3 The Continuous Improvement Cycle.- 1.4 Quality—What Is It Anyway?.- 1.5 Quality Drives Productivity.- 1.6 From Product Control to Process Control.- 1.7 SPC—Why and How.- 1.8 Improving the Status Quo with Statistical Process Improvement.- 1.9 The Kaizen Mine.- 1.10 The Engineer as a Change Agent.- 2 The Basic Tools.- 2.1 Understanding Variation.- 2.2 Clarity with Flowcharts.- 2.3 Sampling.- 2.4 Data Collection Formats.- 2.5 The Power of Concentration Diagrams.- 2.6 Data Grouping: Cause and Effect Diagrams.- 2.7 Data Organization.- 2.8 Data Analysis—Measuring Variation.- 3 The Measurement System.- 3.1 The Measurement System as a Process.- 3.2 Units of Measure—Are They Adequate?.- 3.3 Components of Measurement Error.- 3.4 Level of Measurement Error.- 3.5 Measurement Consistency.- 3.6 Measurement Bias.- 3.7 Measuring Testing Variance.- 3.8 GR & R Studies—Nondestructive Tests.- 3.9 GR & R Studies—Destructive Tests.- 3.10 Signal to Noise Ratio.- 4 Statistical Process Control.- 4.1 Quality Improvement Cycles.- 4.2 Process Stability.- 4.3 Control Chart Background.- 4.4 In Control Versus In Specification.- 4.5 Process Capability.- 4.6 Control Charts for Variable Data.- 4.7 Control Charts for Attribute Data.- 4.8 Special Control Charting Techniques.- 4.9 Conformance (or Run) Charts and Precontrol Charts.- 4.10 CUSUM Charts.- 4.11 Process Targeting.- 5 Using the Tools.- 5.1 From SPC to SPI.- 5.2 Problem-Solving Techniques.- 5.3 Experimenting for Improvement.- 5.4 Tests of Significance.- 5.5 Randomized Designs.- 5.6 Factorial Experiments.- 5.7 Fractional Factorial Designs.- 5.8 Screening Experiments.- 5.9 Mixture Design Techniques.- 5.10 Response Surface Analysis.- 5.11 EVOP.- 5.12 Handling Missing Data.- 5.13 Preventive Measures.- 6 Applications.- 6.1 Overview.- 6.2 Customer Service.- 6.3 Materials Control.- 6.4 Maintenance.- 6.5 Marketing and Sales.- 6.6 Human Resources (Personnel).- 6.7 Purchasing.- 6.8 Quality Department.- 6.9 Safety and Environmental.- 6.10 Management.- Appendix A SPC.- A.1 Standard Deviation on the Normal Curve.- A.2 Process Capability Measures.- A.4 Control Chart Formulas.- A.5 Constants for Control Chart Formulas.- Appendix B Hypothesis Testing and Test Statistics.- B.1 Types of Hypothesis Testing.- B.2 Types of Tests of Significance.- B.7 Random Numbers Table.- Appendix C ANOVA Formats.- C.1 ANOVA Generic.- C.2 CRD ANOVA.- C.3 CRBD ANOVA.- C.4 Latin Square ANOVA.- C.5 Two-Factor Factorial ANOVA.- C.7 Newman-Keuls Method: Analysis of Means.- Appendix D Designed Experiments.- D.1 Latin Square Design Matrices.- D.2 Two-Level Factorial Designs.- D.6 Coefficients of Orthogonal Polynomials.- Appendix E DOE: Screening Designs.- E.1 Eight-Run Plackett—Burman Design.- E.2 Eight-Run Plackett—Burman Design Reflected and Replicated.- E.3 12-Run Plackett—Burman Design.- E.4 16-Run Plackett—Burman Design.- E.5 20-Run Plackett—Burman Design.- E.6 28-Run Plackett—Burman Design.- E.7 L4 Taguchi Design.- E.8 L8 Taguchi Design.- E.9 L12 Taguchi Design.- E.10 L16 Taguchi Design.- Appendix F Mixture Experiments.- F.1 Three-Component Simplex Design.- F.2 Four-Component Simplex Design.- F.3 Five-Component Simplex Design.- F.4 Simplex Screening Design Points.- F.5 Six-Component Simplex Screening Design.- Glossary of Symbols.- References.
Date de parution : 07-2012
Ouvrage de 470 p.
15.2x22.9 cm
Disponible chez l'éditeur (délai d'approvisionnement : 15 jours).
Prix indicatif 52,74 €
Ajouter au panierThème d’A Practical Guide to Statistical Quality Improvement :
© 2024 LAVOISIER S.A.S.
