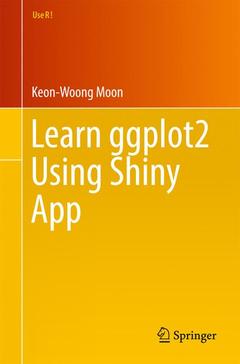
Learn ggplot2 Using Shiny App, 1st ed. 2016 Use R! Series
Langue : Anglais
Auteur : Moon Keon-Woong

This book and app is for practitioners, professionals, researchers, and students who want to learn how to make a plot within the R environment using ggplot2, step-by-step without coding.
In widespread use in the statistical communities, R is a free software language and environment for statistical programming and graphics. Many users find R to have a steep learning curve but to be extremely useful once overcome. ggplot2 is an extremely popular package tailored for producing graphics within R but which requires coding and has a steep learning curve itself, and Shiny is an open source R package that provides a web framework for building web applications using R without requiring HTML, CSS, or JavaScript.
This manual?"integrating" R, ggplot2, and Shiny?introduces a new Shiny app, Learn ggplot2, that allows users to make plots easily without coding. With the Learn ggplot2 Shiny app, users can make plots using ggplot2 without having to code each step, reducing typos and error messages and allowing users to become familiar with ggplot2 code. The app makes it easy to apply themes, make multiplots (combining several plots into one plot), and download plots as PNG, PDF, or PowerPoint files with editable vector graphics. Users can also make plots on any computer or smart phone.
Learn ggplot2 Using Shiny App allows users to
- Make publication-ready plots in minutes without coding
- Download plots with desired width, height, and resolution
- Plot and download plots in png, pdf, and PowerPoint formats, with or without R code and with editable vector graphics
1 Make a plot by click.- 2 Make a plot by ggplot2.- 3 Show Data Distribution.- 4 Scatter Plots(I).- 5 Scatter Plot(II).- 6 Logistic regression.- 7 Labeling points in a scatter plot.- 8 Making a 2D density plot.- 9 Draw 2-dimensional contours.- 10 Ballloon Plot.- 11 Cleveland Dot Plot.- 12 Wilkinson dot plot.- 13 Bar plot(I).- 14 Bar plot(II).- 15 Labelling a bar plot(I).- 16 Labelling a bar plot(II).- 17 Line Graph.- 18 Multiplot with error bars.- 19 Boxplot.- 20 Violin plot.- 21 Area plot.- 22 Polar Plot.- 23 Annotations.- 24 Add a Table Annotation.- 25 Adding the Regression Results in Scatter Plot.- 26 Heatmap.- Horizontal Boxplot.- 29 Drawing a Map.- Interactive Plot.
Keon-Woong Moon, M.D., Ph.D., is Professor of Cardiology at the Catholic University of Korea and serves as the Director of Cardiology at St. Vincent’s hospital. In 2014, he completed the Data Science Specialization course authorized by Johns Hopkins University offered through Coursera. Recently he developed four R packages (mycor, moonBook, ztable, and ggiraphExtra) for distribution on CRAN. He has taught residents, fellows, and junior staff about R and ggplot2 for many years, and he is the author of two books in Korean: R Statistics and Graphs for Medical Papers (2015, Hannarae) and Web-Based Analysis without R in Your Computer (2015, Hannarae).
Step-by-step instructions—a tutorial approach to make beautiful plots without R code Over 400 screen shots and illustrations Makes creating graphics with ggplot2 easy and accessible Includes supplementary material: sn.pub/extras
Date de parution : 04-2017
Ouvrage de 351 p.
15.5x23.5 cm
Thème de Learn ggplot2 Using Shiny App :
Mots-clés :
R graphics; visualization; ggplot2; vector graphics; powerpoint; R code; plot; shiny app
© 2024 LAVOISIER S.A.S.


