Lavoisier S.A.S.
14 rue de Provigny
94236 Cachan cedex
FRANCE

Heures d'ouverture 08h30-12h30/13h30-17h30
Tél.: +33 (0)1 47 40 67 00
Fax: +33 (0)1 47 40 67 02


Url canonique : www.lavoisier.fr/livre/autre/an-introduction-to-r-for-quantitative-economics/dayal/descriptif_3220485
Url courte ou permalien : www.lavoisier.fr/livre/notice.asp?ouvrage=3220485

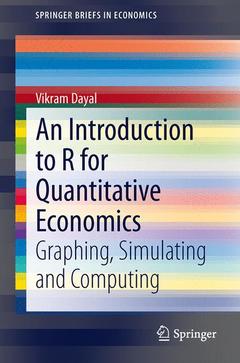
An Introduction to R for Quantitative Economics, 2015 Graphing, Simulating and Computing SpringerBriefs in Economics Series

Langue : Anglais

Auteur :

Couverture de l’ouvrage An Introduction to R for Quantitative Economics
This book gives an introduction to R to build up graphing, simulating and computing skills to enable one to see theoretical and statistical models in economics in a unified way. The great advantage of R is that it is free, extremely flexible and extensible. The book addresses the specific needs of economists, and helps them move up the R learning curve. It covers some mathematical topics such as, graphing the Cobb-Douglas function, using R to study the Solow growth model, in addition to statistical topics, from drawing statistical graphs to doing linear and logistic regression. It uses data that can be downloaded from the internet, and which is also available in different R packages. With some treatment of basic econometrics, the book discusses quantitative economics broadly and simply, looking at models in the light of data. Students of economics or economists keen to learn how to use R would find this book very useful.
Chapter 1. Introduction.- Chapter 2. R and RStudio.- Chapter 3. Getting data into R.- Chapter 4. Supply and demand.- Chapter 5. Functions.- Chapter 6. The Cobb-Douglas Function.- Chapter 7. Matrices.- Chapter 8. Statistical simulation.- Chapter 9. Anscombe's quartet: graphs can reveal.- Chapter 10. Carbon and forests: graphs and regression.- Chapter 11. Evaluating training.- Chapter 12. The Solow growth model.- Chapter 13. Simulating random walks and shing cycles.- Chapter 14. Basic time series.

Vikram Dayal is an Associate Professor at the Institute of Economic Growth, Delhi. He is the author of the book titled The Environment in Economics and Development: Pluralist Extensions of Core Economic Models, published in the SpringerBriefs in Economics series in 2014. In 2009 he co-edited the Oxford Handbook of Environmental Economics in India with Professor Kanchan Chopra. He has been incorporating the use of software in teaching quantitative economics—his  open access notes on Simulating to understand mathematics for economics with Excel and R are downloadable at http(colon)(double back slash)textbookrevolution(dot)org. His research on a range of environmental and developmental issues from outdoor and indoor air pollution in Goa, India to tigers and Prosopis juliflora in Ranthambhore National Park has been published in a variety of journals. He visited the Workshop in Political Theory and Policy Analysis in Bloomington, Indiana as a SANDEE (South Asian Network for Development and Environmental Economics) Partha Dasgupta Fellow in 2011. He studied economics in India and the USA and did his doctoral degree from the University of Delhi.


Introduces the free software R, using its cutting edge interface, R Studio, aimed at economists Starts from simpler topics such as supply and demand and elasticity and goes on to more advanced ones such as simulations of fishing and the Solow growth model Provides information on how to visualize data, which is an important practice stressed by statisticians who have developed and use R Conveys the essentials of graphing, simulating and computing, to build skills with numerical mathematics and data analysis Includes supplementary material: sn.pub/extras

Date de parution :

Ouvrage de 109 p.

15.5x23.5 cm

Disponible chez l'éditeur (délai d'approvisionnement : 15 jours).

68,56 €

Ajouter au panier